You should spend about 20 minutes on this task.
The graph below shows changes in the percentage of households with cars in one European country between 1971 and 2001
Write at least 150 words.
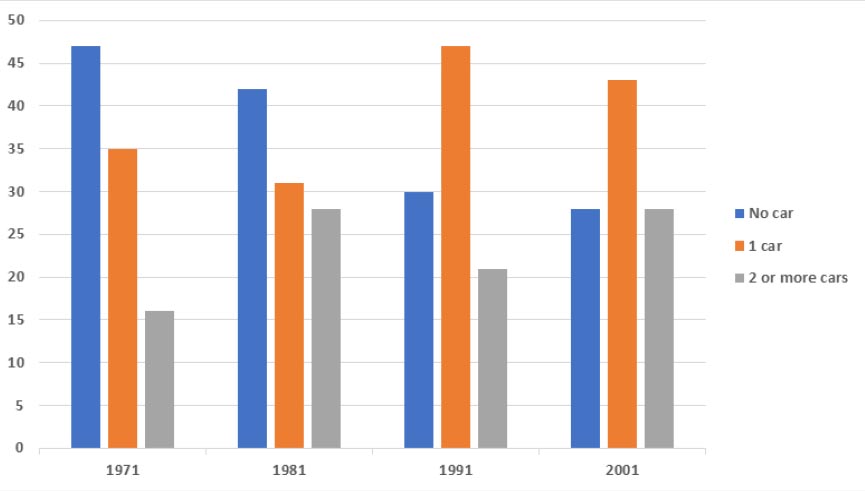
The bar chart illustrates changes in the number of cars per household in a particular European nation from 1971 to 2001.
It is clear that car ownership in this country rose over the period shown. While the percentage of families with one, and two or more cars increased, the figure for households without a car decreased.
In 1971, nearly half of the residents in this country did not possess a car, while about 30% of families owned 1 car, and around 18% of families owned 2 or more cars. Ten years later, the figures for those with no car or 1 car dropped to just over 40% and 30% respectively. Meanwhile, families with 2 or more cars increased to just under 30%.
1991 saw a dramatic rise in 1 car ownership, peaking at almost 50%, while the percentage of families with no car, or 2 or more cars, both decreased. In 2001, the percentage of families with no car, or 2 or more cars, was about equal, at just under 30%, while about 44% of households owned 1 car.
(179 words)
vocabulary
• Car ownership
• To posses = to own (v)
Welcome to my webpage. My name is Bahram Modaberi. I am a content creator and educator of International English tests such as IELTS, TOEFL and GRE in Tehran.
In 2010, I received IELTS Examiner Training in Istanbul, Turkey as a representative of NOET (National Organization of Educational Testing (سازمان سنجش آموزش کشور)).
I administered TOEFL (PBT- iBT) and GRE for NOET from 2001 to 2013. Presently, I am the director of IELTS division at www.ibtil.org (Dr. Borzabadi’s Language Center).
The purpose of this website is to provide IELTS candidates with online practice lessons and tutorials. I plan to develop and add to this site over time. Please stay tuned.
02191300614
info@modaberi.com
شنبه تا چهارشنبه 8 الی 16 - پنج شنبه ها تا ساعت 13 غیر از تعطیلات رسمی

