You should spend about 20 minutes on this task.
The number of international conferences in three cities.
Write at least 150 words.
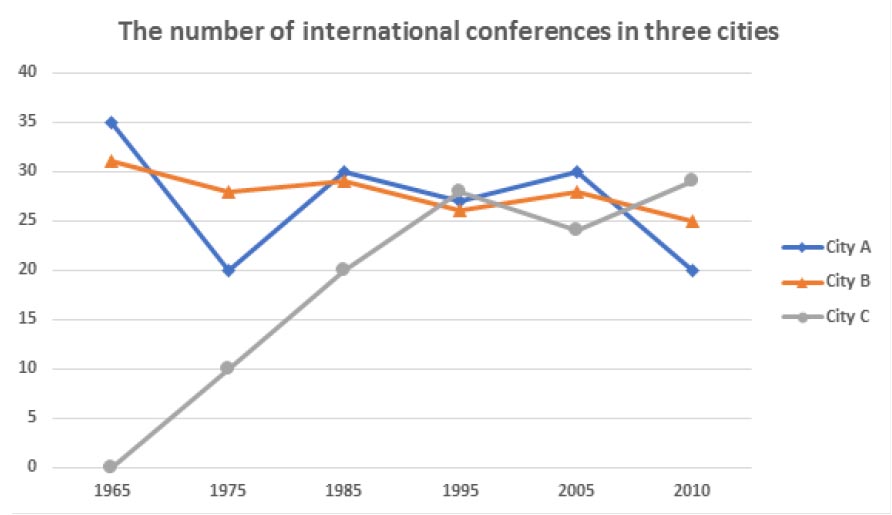
The line graph illustrates the number of international conferences held in three different cities, over a period of thirty-six years, beginning in 1965.
It is clear that while the number of international conferences held in city C increased dramatically, there were some fluctuations in the figures for the other cities over the period shown. Additionally, city C saw the biggest change in its figures.
In 1965, city A held about 35 international meetings, which was the highest figure for all cities in all years, while just under 30 conferences were organized in city B. In contrast, there were no international conferences in city C in that year.
Over the next 35 years, the number of international meetings that took place in city C rose sharply to peak at over 30 in 1980, and then fell slightly before rising again to around 30 in 2010. The figures for the other cities, however, both witnessed some fluctuations throughout the period, both holding approximately 25 conferences each in the final year.
(168 words)
• International meetings = international conferences
• To held = to take place = to organize (v)

