You should spend about 20 minutes on this task.
The pie charts show the destination of export goods in three countries in 2010.
Write at least 150 words.
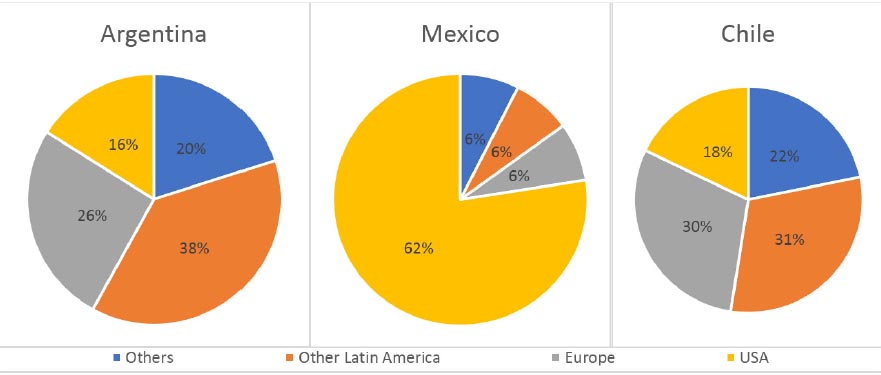
The given pie charts illustrate the percentage breakdown of goods exported from three South American countries, in 2010.
It is clear that while Argentina and Chile’s exports were distributed more evenly among other nations, the large majority of Mexico’s exports were to the USA.
From the charts it can be seen that Argentina and Chile’s export trends were almost identical, with the majority of their exports going to other Latin American countries, at 38% for Argentina, and 31% for Chile. Meanwhile, 26% of Argentina’s exports went to Europe, 16% to the USA, and 20% to other countries. Similarly, Chile’s exports consisted of 30% to Europe, 18% to the USA, and 21% to other countries.
In contrast, the large majority of Mexico’s exports were to the USA, at 82%. The remaining exports from Mexico were to Europe, at 6%, other Latin American countries, at 6%, and other countries, also receiving 6%.
(150 words)
• Percentage breakdown(n)
• Distribute (v)
• Identical (adj)
• Consist of (v)
Welcome to my webpage. My name is Bahram Modaberi. I am a content creator and educator of International English tests such as IELTS, TOEFL and GRE in Tehran.
In 2010, I received IELTS Examiner Training in Istanbul, Turkey as a representative of NOET (National Organization of Educational Testing (سازمان سنجش آموزش کشور)).
I administered TOEFL (PBT- iBT) and GRE for NOET from 2001 to 2013. Presently, I am the director of IELTS division at www.ibtil.org (Dr. Borzabadi’s Language Center).
The purpose of this website is to provide IELTS candidates with online practice lessons and tutorials. I plan to develop and add to this site over time. Please stay tuned.
02191300614
info@modaberi.com
شنبه تا چهارشنبه 8 الی 16 - پنج شنبه ها تا ساعت 13 غیر از تعطیلات رسمی

