You should spend about 20 minutes on this task.
Write at least 150 words.
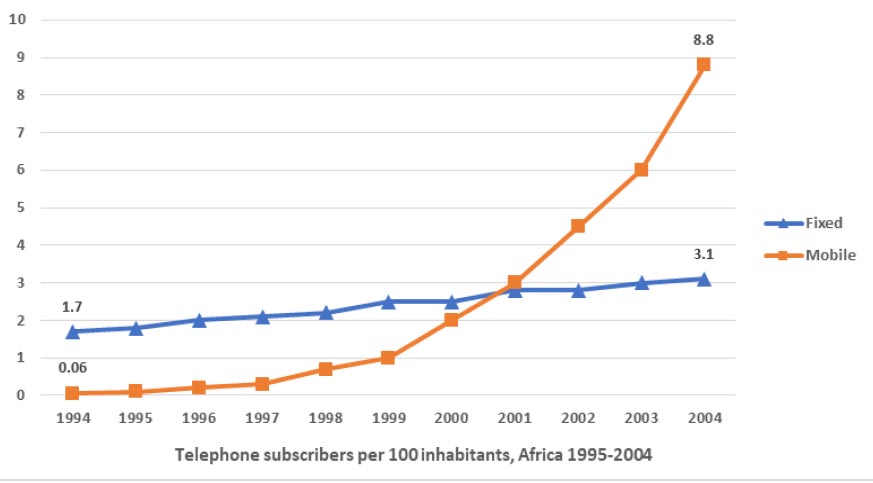
The given line graph compares the percentage of people in Africa who subscribed to mobile, and fixed line phones, from 1994 to 2004.
Overall, the line graph shows that the percentage of subscribers for both mobile and fixed line phones increased over the period. However, while fixed line phones were the most popular choice at the beginning of the period, mobile phones were significantly more popular by the end of the period.
In 1994, 1.7% of African inhabitants subscribed to fixed line phones, with only 0.06% of people using mobile phones. Both types of phone subscription slowly increased over the following four years, with mobile phones increasingly gaining popularity and equaling the percentage of fixed line users in the year 2000, at approximately 2.5%.
From 2000 onwards, while the percentage of fixed line subscribers continued to slowly increase, the percentage of mobile phone users saw a dramatic rise, ending up at 8.8% in 2004, compared to 3.1% for fixed line subscribers in the same year.
(165 words)
• To gain popularity (collocation)
• To equal something (v)
Welcome to my webpage. My name is Bahram Modaberi. I am a content creator and educator of International English tests such as IELTS, TOEFL and GRE in Tehran.
In 2010, I received IELTS Examiner Training in Istanbul, Turkey as a representative of NOET (National Organization of Educational Testing (سازمان سنجش آموزش کشور)).
I administered TOEFL (PBT- iBT) and GRE for NOET from 2001 to 2013. Presently, I am the director of IELTS division at www.ibtil.org (Dr. Borzabadi’s Language Center).
The purpose of this website is to provide IELTS candidates with online practice lessons and tutorials. I plan to develop and add to this site over time. Please stay tuned.
02191300614
info@modaberi.com
شنبه تا چهارشنبه 8 الی 16 - پنج شنبه ها تا ساعت 13 غیر از تعطیلات رسمی

