You should spend about 20 minutes on this task.
Write at least 150 words.
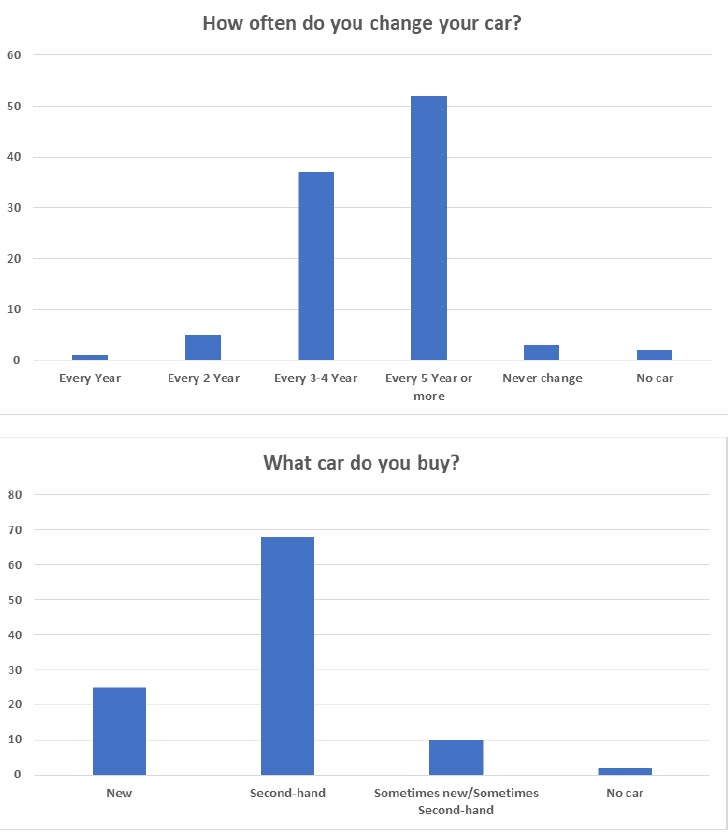
The bar charts display the results from a 2009 survey regarding people’s automobile purchasing habits in a European country.
Overall, it can be seen that the majority of consumers tended to purchase a new car after five years or more of using their old vehicle. Meanwhile, secondhand cars were the most popular choice with regards to the type of vehicle purchased.
The first bar chart shows that approximately 52% of people in this particular country changed cars after 5 or more years, and roughly 37% changed cars after 3-4 years. About 5% of people changed cars every two years, 1% of people changed every year, and approximately 3% of people never changed. Furthermore, about 2% of people didn’t even own a car.
With regards to the type of vehicle purchased, approximately 68% of people chose to buy second-hand cars, while about 25% bought brand new vehicles. In addition, roughly 10% of people sometimes purchased either new or second-hand cars.
(159 words)
• Purchasing habits(n)
• Brand new(adj)

